Why does the large number of titles that Tokyopop publishes inspire phrases like “flooding the market” and “throw it at the wall and see what sticks” when Viz, who also publishes a large number of titles never generates the same complaint?
It's a good question. In terms of sheer number of volumes, TP & Viz put out about the same number of titles per month, but they definitely have a different image in the comics blogosphere. Some of the responder comments point to things like quality, shipping schedule, and Viz's use of imprints.
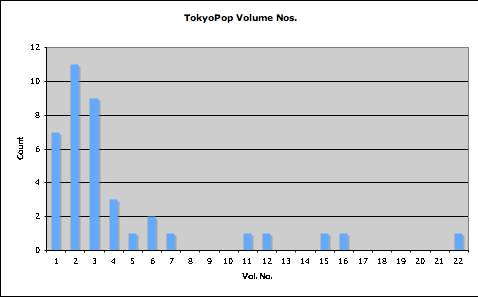
Those are some good anectdotal possibilities--and when you're dealing with perception, anectdotal evidence can go a long way. But I suspected there was something else going on as well, so I did some number crunching. I looked at the TP & Viz sections in the current issue of Previews (September, for items supposedly on sale in November). A pure count shows that TP has 39 volumes, Viz has 38 (for purposes of this analysis I didn't count Shojo Beat or Shonen Jump). But then I counted how many titles each publisher had with a particular volume number; i.e. how many titles were on vol. 1, how many on vol. 2, etc. Here are the results in handy histograms:
TokyoPop:
Viz:
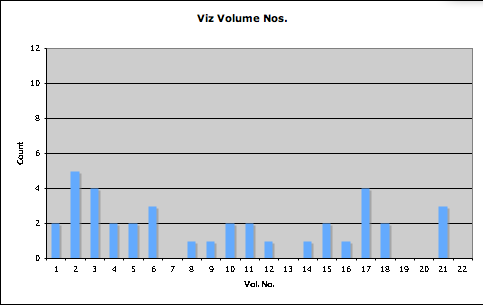
As can be plainly seen from these graphs, TP's output is weighted far more towards the early volume numbers, while Viz's output as a whole is far more mature. The median volume number for TP is 3, while the median for Viz is 8.5.*
So that's where the “throw it at the wall and see what sticks” image for TP comes from; they're putting out a lot more new series every month, while Viz is more likely to stick with longer-running series. This means that each month readers and retailers are faced with an array of many new choices (or ordering decisions) from TP, while with Viz they know more what they're getting into.
Just another piece of the puzzle.
(* You might be tempted to try to take an average, but I think that your college statistics professor would likely have told you that you cannot take averages of ordinal data.)
Update: Three months worth of data graphed here.
No comments:
Post a Comment