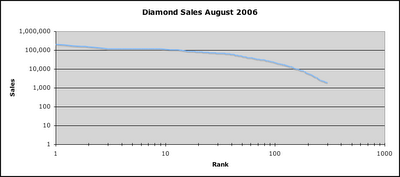
In particular, I decided to take a look at actual sales numbers from Diamond to see if any Long Tail lessons can be learned.
Anderson argues that--absent any market barriers--the natural shape of markets is to follow a power law. This can be visualized by graphing sales rank against number of units sold; on a log-log scale, the graph will be a straight line. Barriers and inefficiencies will cause the tail of the line to bend downward, and the area between the ideal straight line and the downward curve represent lost sales. Typically said graph will resemble a straight line at the top, but at some point it will deviate from the line; this represents an inflection point, and is a point where an analyst can look to see what the problem is and identify solutions.
For example, here's Anderson's graph (taken from here) of US Box Office Gross vs. Film Rank for 2003-2005:

You can see the inflection point at around 350; it turns out that the carrying capacity of US megaplex theaters is a little more than 100/year, and thus over three years they show approx. 350 movies (out of the approx. 13,000 movies that were show in film festivals over the same period).
Anderson surely explains this better in his book, but I think you get the jist here.
So I decided to do a little graphic of my own. I took the Diamond sales figures for August 2006 and graphed them out (click on the graphs to view them at a readable size):
Here's the raw graph:

Here it is as a log-log graph:

And here it is with an idealized market line imposed:

It's not surprising to see that the graph looks like many other markets. What is surprising to me is how soon the inflection point hits: right around rank #45. Looking at the raw data, it appears to be right between #45 (Sensational Spider-Man 29: 55,300) and #46 (Green Lantern Corps 3: 51,400). Put another way, that's right at about the mid-list for Marvel, just after the top books for DC, and above any other publisher.
Putting some names to the numbers: Comics like Y, the Last Man (91: 25,800), Fables (92: 25,300) & Runaways (93: 25,000) could probably be selling another 15-20,000 copies every month. Way down at the end of the tail, books like Gold Digger, Rocketo, & Action Philosophers which are selling 2,100 copies could be selling around the 20,000 range.
This represents quite an unserved market for Diamond. Of course the next question is where is that unserved market going? I suspect there are several places:
* Other distributors (for non-exclusives)
* Newsstand sales (things like Cartoon Block Party & Archie Dougle Digest)
* Trade collections (readers who don't get a comic monthly through Diamond wait for the trade, either at their local store or at a book store or through Amazon)
* Unserved at all (people who would enjoy the comics but don't know about or can't find them)
All of these of course are the concern of Diamond. The last should be a concern to all publishers.
The follow-up question after this is why is the inflection point occuring, and how can it be eliminated? I don't have a good answer yet, but I suspect it has something to do with either the promotional outlay, the 'rack space' for new comics in a typical store, or some combination of the two.
Any other thoughts?
No comments:
Post a Comment